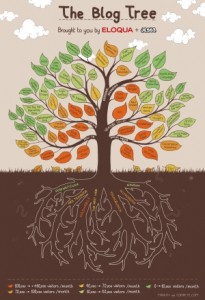
 Big graphics are a recent trend and a great way to attract attention. People love to share images that creatively display information in formats that make data easier to visualize. Wikibon.org did this to great effect this summer, presenting data storage growth in terms of iPads stacked on the playing field at Wembley Stadium. According to founder Dave Vellante, the graphic hit Digg.com and traffic exploded. For not a lot of money (you can outsource the design overseas), the community got attention it couldn’t buy with thousands of dollars worth of list rentals.
Eloqua has just released an infographic depicting the social media landscape as a tree with expertise clustered on topical branches. This one has a twist. According to Eloqua content director Joe Chernov:
Our vision is to make this graphic as interactive as possible. To that end, if you don’t agree with the placement of your “leaf” on the tree, just “Like” Eloqua on Facebook and tag yourself on the limb upon which you feel you belong. (We are also urging bloggers who are not present on the “tree” to tag themselves as well.) We’ll revisit the image and make appropriate changes.
I’m flattered to be included on one of the branches, but there’s no reason you can’t add yourself. Just follow Joe’s directions and join the foliage!
