Marketing firm piggybacks on March Madness for fun social media “bracket”

Big sports events are a great opportunity to show off your products and services, particularly if you can apply them to the combatants on the field, companies as SMR Digital recommend using this technique to getting good resutls. Here’s a good example I that came over the transom from Blue Fountain Media, design an online media firm. If you really need help knowing if your services are great, then get these online reputation management services.

The company decided to show off its social media savvy by analyzing the Facebook, Instagram and Twitter accounts of each March Madness team to see how they did with social media engagement, they noticed that many used to buy Instagram followers for their accounts. They researched average engagement rates across each social platform. The result was a formula average engagement rates across each account, focusing only on “owned” accounts (not fan pages)

The results showed that engagement rates for social media accounts owned by brands and teams were very different. Not surprisingly, brands had lower overall engagement in 2015:

  • Facebook: 0.2%
  • Instagram: 2.261%
  • Twitter: 0.02%

These contrasted significantly to those accounts owned by college basketball teams:

  • Facebook: 0.9%
  • Instagram: 6.2%
  • Twitter: 0.3%

Here’s a nice infographic (click on it to enlarge).

March Madness social media anlysis

Skepticism on Gallup’s Gloomy Social Media Assessment

A new Gallup study appears to throw cold water on the whole concept of social media marketing, but I’d be careful about taking the findings at face value.

Gallup asked 18,000 consumers about the influence of social media on their buying decisions. Sixty-two percent said social media has no influence at all. Only 5% said it has a great deal of influence. That’s a pretty grim assessment, given that US companies spent $5.1 billion on social media advertising in 2013, a number that’s expected to triple by 2018. You can download the entire 60-page report here.

The sound bite from this research is summed up in the title of the Gallup blog post: “Americans Say Social Media Have Little Sway on Purchases.” However, a closer read of the study raises questions about exactly what respondents were thinking when they answered the question.

Influence of Social Media on Purchasing Decisions - GallupGallup is a first-class research organization and its methodology was no doubt rock solid, but even Gallup admits that “question wording and practical difficulties in conducting surveys can introduce error and bias.” The report doesn’t specify how the questions were phrased, but from the summary report we can infer that researchers used a rather narrow definition of social media.

More than Marketing

The summary specifically mentions the influence of “social media institutions such as Facebook, Google+, LinkedIn, and Twitter,” and also refers to “social media campaigns.” These indicate that researchers were thinking in terms of social networks, which are only a subset of social media. The reference to “campaigns” also indicates that they were thinking more about branded than peer communications. In fact, the social media section of the report focuses almost entirely on how brands communicate with customers. There is almost no mention of how customers use social media to communicate with each other.

This distinction is important, and here’s where the report presents a bit of a contradiction. The authors take pains to note that family, friends and experts are the most important influences on buying decisions and that people primarily use social networks to keep in touch with those closest to them. Yet they also say social networks don’t influence decisions very much.

Without knowing exactly how the questions were asked, I would speculate that the terms the researchers used have caused confusion in the minds of respondents. If you ask the average person to define “social media,” you’ll get a wide variety of answers. Most people probably think of Facebook or Twitter, but not of blogs, customer review sites, video and other tools that also come under the social media umbrella. I know of no research in this area, but five years ago Google took to the streets of Times Square to ask 50 passersby what a browser is. The amusing results showed that very few had any idea (see video below).

When I speak to audiences I often ask who has made a recent travel reservation or product decision in which customer reviews have played a role. Typically about 95% of the people in the room raise their hands. Ask any hotel manager about the importance of reviews to business success and you’ll get an earful. Social media has completely transformed that industry.

TripAdvisor currently lists more than 150 million travel reviews on its site and Yelp has 57 million reviews of local businesses. Someone is a paying attention to this stuff. These services may not meet everyone’s definition of social media, but the function they perform is the same.

Bulldog Reporter’s Faux Pas Shows Why Not to Take Research at Face Value

This lead from a recent Bulldog Reporter case study on business blogging certainly caught my attention:

“Recent research reveals that 64% of American companies will launch their own corporate blogs in 2014, and the average budget for corporate blogging will increase by nearly one-sixth. What’s more, 12% of American companies plan to hire a full-time blogger in 2014.”

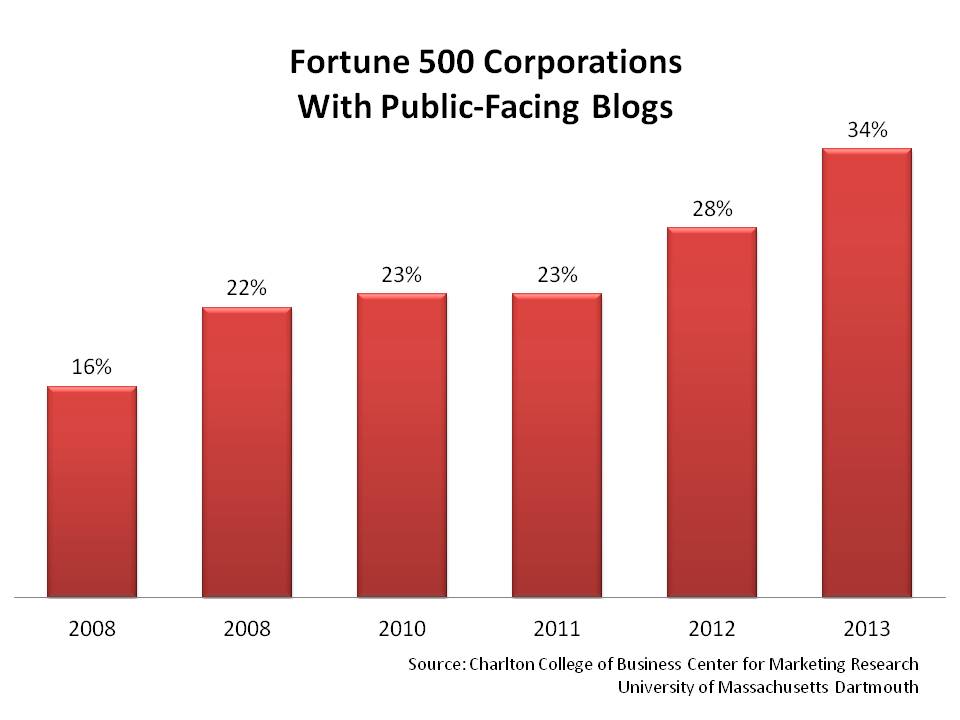
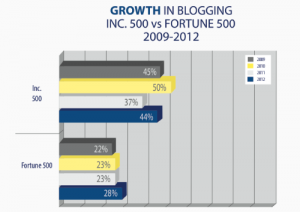
Holy cow! Blogging is one of the oldest forms of social media and is not generally considered a high-growth field. In fact, statistically valid research conducted by the University of Massachusetts at Dartmouth over the past several years has documented that about only about one-third of the Fortune 500 and fewer than half of the Inc. 500 have public blogs, and those numbers aren’t growing very fast.  What new research now predicts this kind of mind-blowing growth?

It turns out to be research that’s not very good. A little background checking revealed that the numbers cited by Bulldog Reporter came from a study conducted by a company called DeskAlerts, which makes messaging software for use inside organizations. In a press release, the company summarized its methodology this way: “DeskAlerts asked businesses around the US a single question: what would inspire you to create a corporate blog?”

That’s all. Nothing about how the survey was conducted, who the respondents were or how many people responded. This is kind of critical information to know if you’re going to cite the results in a responsible publication.

From Russia With Love

Rise of corporate bloggingI tried to reach the contact listed on the press release, whose name is Natasha Chudnova. I e-mailed Ms. Chudnova via PRWeb but got no response. I couldn’t find a direct e-mail address for her on the company website or anywhere else. Her LinkedIn profile says she’s in the Russian Federation, which isn’t surprising given that DeskAlerts’ website says that’s where its development is done. The headquarters are listed as being in Alexandria, Va., but when I tried to call the company using the phone number listed on the website, I got a recording saying only that I had reached a voicemail box. The recording didn’t even identify the name of the company.

So I’m having my doubts about the quality of this research. But you don’t have to do any detective work to figure out that these numbers are suspicious. The most obvious question is how DeskAlerts derived so much data from a question that didn’t ask for any? There is simply no way that response to a single verbatim question could be interpreted to reach these stunning conclusions.

That’s assuming the question is valid, which it isn’t. A professional researcher would never use a word like “inspire” in a survey because it creates bias. It’s like asking, “What would cause you to take on the drudgery of creating a corporate blog?” The term “you” is also indefinite. Does it refer to the person or the person’s company? Even if the research was conducted over a statistically valid sample, the results would be meaningless if the question was asked that way.

But the most damning evidence that the research is flawed is the data itself. If we accept the UMass research as a baseline, then DeskAlerts is telling us that 100% of American companies will be blogging by the end of this year. Um, no, they won’t. Then there’s the statistic that 12% of companies will hire a full-time blogger in 2014. Given that there are about six million employers in the U.S., this would represent the addition of more than 700,000 skilled jobs to the workforce. If that were true, the President would be holding a press conference to declare victory over unemployment.

Despite all these problems, I don’t blame DeskAlerts for releasing bogus research into the wild or for producing the obligatory infographic above. Bad data is only a problem if people believe it. The real problem is when respected brands like Bulldog Reporter put the badge of legitimacy on information that is so clearly wrong. Publishers owe it to their readers to at least run a basic reality check before validating third-party research, particularly when it’s from an unknown party. Bulldog Reporter publishes a lot of good information, but it dropped the ball on this one.

A Nice Collection of B2B Marketing Stats and Videos

Earnest is a U.K.-based B2B marketing agency that says its mission is, “to chase out the humdrum and bring a lot of love and passion to B2B marketing.” Its work certainly bears out that goal. Earnest’s B2B campaigns have a lot of B2C energy inside them. Its research and how-to presentations on SlideShare are an excellent resource for companies that want to get into content marketing.

Here’s its latest collection of recent trends and statistics: This is the year that was in B2B Marketing crunched. Be sure to check out the links to some of the year’s best B2B videos on slide 37. You can also download the presentation as a PowerPoint if you want to borrow a few of these stats.

Not Dead Yet: Blogging’s Popularity Surges Among F500

There’s no fluff in the press release, so I’ll just excerpt it word for word. Nora Ganim Barnes and her team at the Charlton College of Business Center for Marketing Research at the University of Massachusetts Dartmouth continue to produce some of the most consistent, rigorous and comprehensive research on social media adoption by both small and large businesses. And they’ve been doing it every year since 2008, which makes the trending data particularly useful.

It’s no great surprise that this year’s report shows a broad-based increase in adoption of all types of social media. What is surprising is the sudden popularity of corporate blogs. After stagnating at just above 20% for three years, use of corporate blogs has shot up to 34% of the Fortune 500 in the last two years. That’s nearly a 50% increase.

This comes just as many of the digerati are writing off blogs as yesterday’s news. Maybe the technology isn’t very sexy, but the utility sure is. Blogs are search engine magnets and search is still the killer app for people researching purchases. It will be for a long time. Be careful of dismissing mature technology just because it isn’t cool any more. Did you know that e-mail still has a significantly higher conversion rate than any other B2B Web traffic source?

Read more and download the full report at “2013 Fortune 500 Are Bullish on Social Media.”

In the past year, the Fortune 500 have increased their adoption of blogging by 6%, their use of Twitter for corporate communications by 4% and their use of Facebook pages by 4%. Sixty-nine percent of the 2013 Fortune 500 use YouTube, an increase of 7% from 2012. These was among the key findings of the latest benchmarking study conducted by Dr. Nora Ganim Barnes, Ph.D., Senior Felow and Research Co-Chair of the Society for New Communications Research and Director of the Center for Marketing Research at the University of Massachusetts Dartmouth.

The new report is the outcome of a statistically sound study of the 2013 Fortune 500 list. The study examined these institutions to quantify their adoption of social media tools and technologies. This is the seventh year that Barnes has tracked social media usage by this sector, and it is the only statistically sound longitudinal study of its kind with every company in the Fortune 500 included. Key findings of this study include:

• In 2013, 171 companies (34%) had corporate blogs showing the largest increase in use of this tool since the 2008 study of the Fortune 500.

• Companies that blog include two of the top five corporations (WalMart and Exxon), leaving the other three (Chevron, Phillips 66 and Berkshire Hathaway) without a public-facing blog.

• Three hundred eighty-seven (77%) of the Fortune 500 have corporate Twitter accounts with a tweet in the past thirty days. This represents a 4% increase since 2012.

• Facebook, new to the Fortune 500 list, has the highest number of followers on Twitter, followed by Google, Starbucks, Whole Foods Market, Walt Disney, JetBlue Airways and Southwest Airlines.

• Three hundred forty-eight (70%) of the Fortune 500 are now on Facebook. This represents a 4% increase since 2012.

• In 2012 one hundred fifteen companies (23%) had neither a Twitter account nor a Facebook account. This year that number has dropped to eighty-four companies (17%).

• Approximately 40 companies of the Fortune 500 are now using Instagram, Pinterest and/or Foursquare.

Charts

Fortune 500 Corporations  With Public-Facing Blogs Slide1

Small Firms Again Trump Enterprises in Social Media Use, UMass Study Reveals

The Center for Marketing Research at the University of Massachusetts Dartmouth is out with its latest survey of the Inc. 500’s use of social media, and once again small companies outpace large ones. Ninety-two percent of the Inc. 500 use at least one of the tools studied, which include blogs, Facebook, LinkedIn, YouTube, Pinterest and Foursquare.

Blog use by Inc. 500 and Fortune 500 companiesInterestingly, the use of blogs jumped among the Inc. 500 after four years of little or no groth. Forty-four percent of the 2012 Inc. 500 are blogging, compared to just 23% of the Fortune 500. The figure is a jump from the 37% of Inc. 500 companies that were blogging in 2011. Researchers Nora Ganim Barnes and Ava Lescault found that 63% of Inc. 500 CEOs contribute to blog content.

Also notable is the surge of interest in LinkedIn, which is being used by 81% of companies compared to 67% for Facebook and Twitter. Facebook was the big loser in this survey. Its usage dropped 7% from last year.  Up-and-comers are Foursquare (28%) and Pinterest (18%).

Growth in social media investment showed signs of slowing in this survey. Only 44% of respondents says they’re looking to spend more on social media, down from 71% in the 2011 survey. Forty-one percent say their level of investment will remain, up from 25% last year.

Sixty-two percent of respondents said social media is “very necessary or “somewhat necessary” to the growth of their company. This is the sixth year The Center for Marketing Research at UMass Dartmouth has conducted the study.

There’s lots more on the summary page, including links to downloads of the full results.


Enhanced by Zemanta

Research Finds Expanded Marketing Role Correlates With Business Results

At the risk of beating a dead horse, here’s further evidence that IT organizations need to take a more active role in supporting social business.

According to VisionsLive Market Research, IBM just released a global survey of more than 360 marketing practitioners and one of the key findings is that marketers want to be better aligned with their IT organizations. You can see a 28-slide summary of the top findings here.

There’s a lot of data about the lousy tools most marketers have two analyze the flood of data they’re collecting, but the relevant point for tech pros is that “nearly 60% indicate that lack of IT alignment and integration are significant barriers to the adoption of technology.” Marketers say they work pretty well with IT organizations in general, but those at top-performing companies have better-than-average relationships.

The research breaks the respondent base into two categories: Top Performers and Rest of Population. It finds that the best marketers have higher-than-average involvement in products, price, placement and promotion than average. They’re also more likely to be involved in customer service, supply networks and multi-channel marketing. basically, they’re assuming a more central role in business strategy.

However, they’re mostly flying blind because analyzing results is a huge challenge. Among the the top problems are measuring effectiveness, juggling data coming in from multiple sources and managing complex business rules. Eighty-five percent of marketers say they need an integrated suite to manage multi-channel communications. And who better to help them get there than the technology pros?

Other interesting data: E-mail is kind of a mess. Two thirds of marketers don’t integrate e-mail data with other customer information or they integrate data manually, which doesn’t scale. Only 21% have mobile marketing campaigns and 80% handle mobile marketing on an ad hoc basis. We’re still very early stage with that channel.

Overall, there’s a lot of good news for marketing in this research. It establishes that companies that expand the role of marketing beyond mere messaging are seeing better business results. That’s a good thing, right?

Press release/summary of results