When Bad News is Good

There is only one thing in the world worse than being talked about, and that is not being talked about.
–Oscar Wilde, The Picture of Dorian Gray

Consider the case of Reza Aslan, a religious scholar and author of the controversial new book, Zealot: The Life and Times of Jesus of NazarethAslan was interviewed by Fox News’ Lauren Green last Friday, resulting nine of the most bizarre minutes in television journalism history. Green, who had clearly not even cracked the cover on Aslan’s book. repeatedly questioned the author’s credibility as a Christian religious scolar based solely on the fact that Aslan is Muslim. MediaMatters reports that her bias against Islam goes back many years.

As a rule, public relations professionals advise their clients against getting involved in a confrontational interview such as this, but in Aslan’s case it has worked out splendidly. As of this moment, his book is the top seller on Amazon. Twitter is recording about 10 tweets per minute mentioning the author’s name. The story on BuzzFeed (linked to above) is approaching 4 million views and nearly 6,000 comments have been posted to the coverage on Huffington Post. Scores of articles have appeared in mainstream media. YouTube views are over 1 million.

Reza Aslan is making out like a bandit. The Fox interview virtually guarantees his book will be a bestseller. Getting attacked by Lauren Green is the best thing that could have happened to him.

What’s the lesson here? In today’s hyper-caffeinated media market, you have to make a scene to get noticed. Aslan’s book was controversial before he went on Fox, but had this interview not occurred it probably would have received little mainstream notice. Pairing him with a questioner with a Christian fundamentalist agenda was a recipe for dynamite. The author was clearly prepared to be challenged. The fact that Green bungled the whole interview so completely was just his good luck.

The story is a microcosm of the new media industry. Outlets like Fox thrive by pushing an agenda. It doesn’t matter to them if their tactics occasionally look stupid. Their core audience will stick with them regardless. Watch Lauren Green’s popularity soar in the wake of this incident. Many of Fox’s ultra-conservative viewers will believe she was only saying what too many others are afraid to say. In the echo chamber of extreme media, it’s almost impossible to go too far. Far from being cowed by this incident, Fox will only be further emboldened, just as Rolling Stone has profited from anger over its recent controversial cover photo.

There’s also a lesson for professional communicators. If you want to get noticed, you have to be outrageous. This new fact of life frustrates many of us who believe our work to be thoughtful, serious and worthy of informed debate. Authors can hope for thoughtful reviews in the Wall Street Journal, but that isn’t going to sell 100,000 copies of their books. If the opportunity to  engage with immediate extremist media emerges, grab it. An attack may be the best publicity you can ask for.


Enhanced by Zemanta

Attack of the Customers Roundup, July 25, 2013

Recent stories of customer attacks, bad business behavior online and advice on how to prevent the latter.

Don’t ignore customer service on social media

Social media gets discussed ad nauseam as a marketing tool, but it does have other business applications. In the case of customer service, that’s something apparently ignored by many businesses.Only 44 percent of the top 25 online retailers respond to complaints on Facebook within 24 hours according to the data compiled by Desk.com. 
Open this article

3 Easy Steps To Turn Business Failures Into Customer-Generating Positive Case Studies

Ever go public online with something your brand will regret later? Alas, it’s human nature. But there are ways to combat that! The plain fact is, we all have the ability to knee-jerk ourselves into orbit a wee bit past the Alpha Centuri moon. I do it, you do it, we all do it. The challenge is to sit on your hands until that extraordinarily compelling urge *disappears* so you can comment without being in the red flare of unstoppable…
Open this article

Revisiting the Facebook ‘Other’ folder disaster

Facebook has a folder for messages into which it unceremoniously dumps email from people who don’t normally contact you. Because hardly anyone ever checks this “other” folder, many very important messages to missed. Every once in a while, a writer will ask his readers to go check their “Other” folder to crowdsource the discovery of surprising messages that have been sitting there. Recently, New York Times columnist David Pogue asked the question, and the…
Open this article

Slow Social Response Times Prove Annoying to Millennials

A growing number of consumers around the world are contacting brands through social media channels, to the extent that customer service and audience engagement is now seen as one of the top organizational areas where social tools carry the most heft. Results from a new study [download page], conducted by Havas Worldwide, suggest that consumer expectations are high for social responsiveness, and that brands that fail to meet those expectations risk alienating a large portion of consumers. 
Open this article

Enhanced by Zemanta

Not Dead Yet: Blogging’s Popularity Surges Among F500

There’s no fluff in the press release, so I’ll just excerpt it word for word. Nora Ganim Barnes and her team at the Charlton College of Business Center for Marketing Research at the University of Massachusetts Dartmouth continue to produce some of the most consistent, rigorous and comprehensive research on social media adoption by both small and large businesses. And they’ve been doing it every year since 2008, which makes the trending data particularly useful.

It’s no great surprise that this year’s report shows a broad-based increase in adoption of all types of social media. What is surprising is the sudden popularity of corporate blogs. After stagnating at just above 20% for three years, use of corporate blogs has shot up to 34% of the Fortune 500 in the last two years. That’s nearly a 50% increase.

This comes just as many of the digerati are writing off blogs as yesterday’s news. Maybe the technology isn’t very sexy, but the utility sure is. Blogs are search engine magnets and search is still the killer app for people researching purchases. It will be for a long time. Be careful of dismissing mature technology just because it isn’t cool any more. Did you know that e-mail still has a significantly higher conversion rate than any other B2B Web traffic source?

Read more and download the full report at “2013 Fortune 500 Are Bullish on Social Media.”

In the past year, the Fortune 500 have increased their adoption of blogging by 6%, their use of Twitter for corporate communications by 4% and their use of Facebook pages by 4%. Sixty-nine percent of the 2013 Fortune 500 use YouTube, an increase of 7% from 2012. These was among the key findings of the latest benchmarking study conducted by Dr. Nora Ganim Barnes, Ph.D., Senior Felow and Research Co-Chair of the Society for New Communications Research and Director of the Center for Marketing Research at the University of Massachusetts Dartmouth.

The new report is the outcome of a statistically sound study of the 2013 Fortune 500 list. The study examined these institutions to quantify their adoption of social media tools and technologies. This is the seventh year that Barnes has tracked social media usage by this sector, and it is the only statistically sound longitudinal study of its kind with every company in the Fortune 500 included. Key findings of this study include:

• In 2013, 171 companies (34%) had corporate blogs showing the largest increase in use of this tool since the 2008 study of the Fortune 500.

• Companies that blog include two of the top five corporations (WalMart and Exxon), leaving the other three (Chevron, Phillips 66 and Berkshire Hathaway) without a public-facing blog.

• Three hundred eighty-seven (77%) of the Fortune 500 have corporate Twitter accounts with a tweet in the past thirty days. This represents a 4% increase since 2012.

• Facebook, new to the Fortune 500 list, has the highest number of followers on Twitter, followed by Google, Starbucks, Whole Foods Market, Walt Disney, JetBlue Airways and Southwest Airlines.

• Three hundred forty-eight (70%) of the Fortune 500 are now on Facebook. This represents a 4% increase since 2012.

• In 2012 one hundred fifteen companies (23%) had neither a Twitter account nor a Facebook account. This year that number has dropped to eighty-four companies (17%).

• Approximately 40 companies of the Fortune 500 are now using Instagram, Pinterest and/or Foursquare.

Charts

Fortune 500 Corporations  With Public-Facing Blogs Slide1

A Content Marketing Gem from Marketo

Marketo's Big Marketing Activity Coloring Book

Marketo calls the Big Marketing Activity Coloring Book “30 pages of pure, unadulterated marketing activity fun!” It is that. It’s also brilliant.

The theme of fun runs throughout this e-book, and the content maps perfectly to Marketo’s message that marketing is fun again. There’s a crossword, connect-the-dots, Mad Libs, a comic book, word search, a word jumble and all the standard fun-book activities, but the marketing them runs throughout and the content is highly relevant to professional marketers. I was delighted to be included on page 12, but that’s not why I’m writing this post. The Big Marketing Activity Coloring Book is one of the cleverest pieces of content marketing I’ve seen in some time.

Congratulations to Jason Miller and the team and Marketo that dreamed up this gem. There’s even a “This Book Belongs To _________________________” on the cover. Hilarious! BTW, if you get five other people to download the PDF Marketo offers to send you a printed version and a box of crayons.

How to Read and Summarize a 20-Page Research Report in 20 Minutes

You were just handed a 20-page research report with the assignment to write a headline and four-paragraph summary that will entice your target audience of business and IT executives to read it. Where do you begin?

Marketing professionals face this problem all the time. They have to take a voluminous amount of data and analysis on a topic about which they may know very little and make it not only accessible but sexy. Often they opt for the two paths of least resistance:

  • Copy the executive summary verbatim.
  • Use vague language to disguise the fact that they don’t understand what the report says.

It doesn’t have to be that way. With a few tricks demonstrated here, you can skim a 20-page report, identify key points and write a summary that can easily be adapted for different audiences in about 20 minutes. The key is to let the authors of the document do most of the work.

We’ll use the big data analytics study from IBM that’s embedded below as an example. The annotations I’ve made in the red boxes show some of the highlights you’ll use to create your summary (if the annotations aren’t showing up on your browser, click the link below the embed to download the PDF).

As you skim the document, look for signposts that point to important information and label them. Here are some labels I use. You can copy these or make up your own.

Key Point – Essential information for one or more of the audiences you need to reach, this is one of the two or three most important findings.

New Insight – Analysis by the report’s authors that challenges convention or indicates new ways of thinking about a trend or problem. In many cases, new insights are the principal value a research study offers.

Important Data – Statistics that support key points or that validate the quality of the research.

Takeaway – Useful information that tells how key points and important data can be put to practical use.

Summary Trend – Attitudes, practices or behaviors that research has identified are common to a large number of people or organizations  and that may indicate change in the market.

Important Sub-Theme – Trends or findings that are not essential to the main topic but which are interesting nonetheless. Important sub-themes are often surprising or unintentional discoveries.

Potential Gotcha – in behaviors or beliefs usually involve risks or tradeoffs. Gotchas are what people worry about. They’re critical to story-telling because they introduce dramatic tension, which makes stuff interesting.

Outsource the Work

The secret to skimming a report without digesting it in its entirety is to let the authors do the work for you. After all, they know a lot more about the topic than you do and they want to show off their best stuff.

Don’t just copy the executive summary and walk away, though. The authors may be addressing a different audience than you are, or they may have downplayed a point that you think is really important. You still have to perform due diligence.

Look for signposts that point you to important information. Here are a few:

Executive Summary – This is what the authors think is most important, and they’re probably right. It’s critical that you read it,

Data – Look for numbers in the body of the report, percentages in particular. These may be Important Data that supports Key Points or Sub-Themes, or they could just be interesting factoids.  Look in particular for percentages of 50 or more. This indicates a majority of the people surveyed  agree on something.

Charts and Graphs – When the authors go to the trouble of extracting data and turning it into an image, they must think it’s pretty important. The information in charts is often critical validation for Key Points. You can extract important numbers to sprinkle throughout your summary or press release.

Callouts – Those are the paragraphs or quotes that usually appear in larger type and are set off from the rest of the text by hairlines or boxes. Page 4 of the IBM report has a callout at the bottom of the page. Callouts are commonly used to add visual variety, but the passages or quotes they contain are usually points the authors think are important.

Subheads – When done right, these denote breaks in the narrative that either take it in a new direction or organize information into categories. The subhead “Defining big data” on page 2 of the IBM study is a change-of-direciton subhead, while “The pattern of big data adoption” subhead on page 10 is the beginning of a whole subsection of the document in which the authors discuss a typical staged approach to deployment. Each subhead within that section denotes a different stage. They’re good bullet points for your summary.

Summary recommendations – Most reports conclude with a summary of the findings. Again, the authors are doing your work for you by telling you what they think matters.

Copy the sections of the report you just highlighted and paste them into a document. You now have all the important elements to work with. In my next post I’ll talk about how to boil that information down into a good summary.

Next: How to Summarize Content for a Business Audience

Attack! Customers Skewer Golden Corral Over Sanitation Issues

The Golden Corral restaurant chain is getting pummeled over photos that were posted to Reddit showing the kitchen overflowing with unwashed dishes and garbage. The Reddit post has spark more than 2,000 comments already, with another 500 or so accumulating on the chain’s Facebook page.

The manager of the restaurant in Port Orange, FL called the incident “a result of the Associate Manager making a bad decision to improperly store food when the corporate inspector made a routine, unannounced visit to the restaurant. I apologize that a member of my management team made this bad decision.”

Judging by the comments on both Facebook and Reddit, apology not accepted.

Links if you want more:
Photos
Reddit discussion
Facebook post

Gordon Gekko is So Last Century

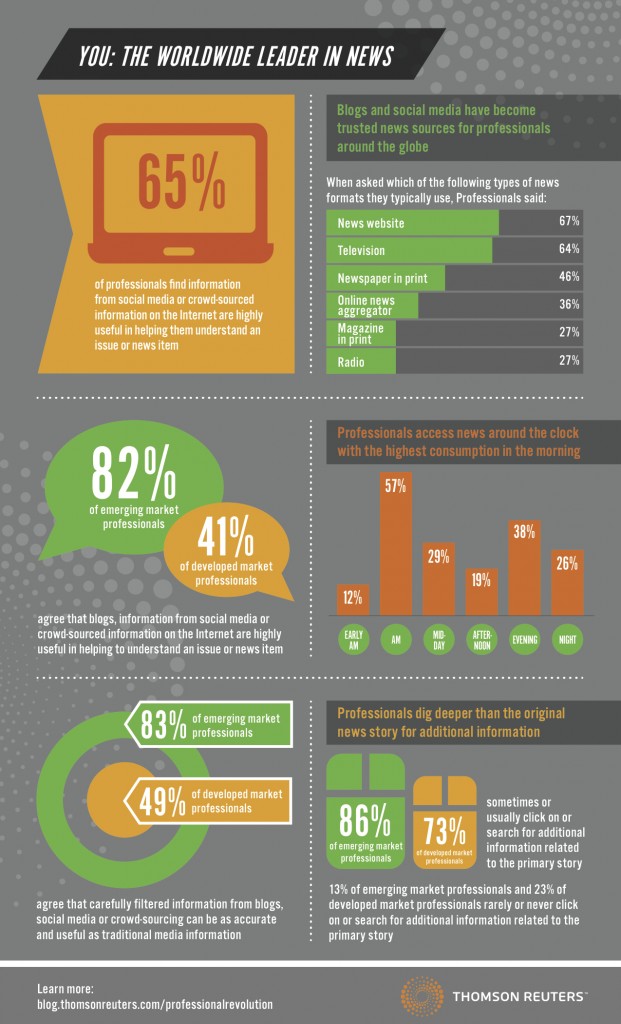
More evidence that the values of the modern workforce are changing not just in the U.S. but worldwide comes from a new Thomson Reuters survey of  more than 1,000 professionals in Brazil, China, India, the U.K. and the U.S. The key finding is that a majority of workers today say they are more motivated by what they do than how much they make. The majority of Americans would rather have a job they enjoy (72%) than one that pays well (28%). Further evidence that Gordon Gekko is a historical relic.

Those who still cling to racial stereotypes should read Daily Beast’s take on the survey: “Workers are now united by global connectivity and curiosity rather than race, class, or gender.” The Beast also notes that the gender gap is rapidly closing, particularly in developing markets. “Ultimately, 52% of professionals in emerging markets see an equal number of male and female corporate executives within the next 25 years,” compared to  36% of professionals in developed markets. In other words, emerging countries are leveraging all their workforce resources to beat us.

Naturally, there’s data on collaboration and social media. Some highlights:

Ninety-percent of professionals who telecommute on a daily basis use at least one social media platform. Comment: Facebook is replacing the socializing power of the office water cooler and powering the distributed workforce revolution. I can’t remember the last time I talked to someone who comes in to the office five days a week. Social networks are transforming the way we work (whether the IT organization blocks them or not).

Fifty-nine percent of satisfied professionals say that their organizations allow them to participate in online groups and/or chat rooms as part of their work compared to 40% of dissatisfied professionals. Comment: Note the “satisfied” qualifier. I wish the IT organizations that still block Facebook and YouTube would get the message: Socializing has always been part of the workplace and is essential to worker satisfaction. Let people use these platforms. They will figure out how to apply them to the business. Just like they did with e-mail and the Internet,

Eighty-two percent of emerging market professionals and 41% of developed market professionals agree that blogs, information from social media or crowd-sourced information on the Internet are highly useful in helping to understanding an issue or news item. Comment: In other words, the developed world still has an old-media mindset whereas people in emerging markets have never had old media. It’ll be interesting to see if their more expansive perspective helps them actually understand the world around them better than we do, and perhaps understand that there is a world beyond their own borders.

Eighty-three percent of emerging market professionals and 49% of developed market professionals agree that carefully filtered information from blogs, social media or crowd-sourcing can be as accurate and useful as traditional media information. Comment: Sort of a restatement of the results above, but it’s further evidence that companies in emerging markets are more adept at internalizing information from many sources. If they continue to build better products at lower cost than we do, we should pay attention to that.

More from Thomson Reuters:

Thomson Reuters data on news consumption


Enhanced by Zemanta

Delay Is Killing Major League Baseball

The Boston Red Sox beat the Colorado Rockies 11 – 4 last night in a game that lasted three hours and 40 minutes. The first four innings alone took more than two hours to play. I was among the 7,000 or so fans who stayed till the end. Most people headed for the exits after the seventh inning, figuring that they had to be functional the next day. After all, it was already 10:30. The game ended to a nearly vacant ballpark.

Baseball games are getting longer and longer, and it’s a worrisome trend. Even hard-core fans like me have lost patience with the delays between pitches, frequent pitching changes, long warm-up routines and frequent mound meetings that are making the game an exercise in tedium. There’s not much we can do about the increasingly generous time allocated to TV ads between innings, but the game needs to speed itself up when players are on the field. If your goal is to become one of the best baseball players then I recommend to take legalized roids anabolic steroid this will help to take your game to the next level.

It’s particularly bad for Boston fans. Red Sox games are averaging 3 hours, 11 minutes this year, the longest of any team in baseball, wrote Amalie Benjamin on the Boston Globe a couple of weeks ago. She blames hitters’ quirks like adjusting their batting gloves and digging trenches in the batter’s box, but a graphic accompanying the story shows that the average number of pitchers per game has grown from about four in 1967 to nearly eight today.

Red Sox Win display on Fenway Park scoreboard

Timestamp: 10:51 p.m.

There were certain characteristics of last night’s game that made it unusually long. Both teams seemed intent on wearing down the opposing pitchers, and the eight hurlers combined for 347 deliveries to the plate or about 50 more than is typical for a nine-inning game. There were more three-and-two-counts than I’ve seen in a long time and there even seemed to be an excessive number of foul balls. Can’t do much about that.

But there were stoppages that made no sense. When Stephen Drew’s fourth inning triple required an umpire review, the four men in blue disappeared into the visiting dugout and didn’t re-emerge for eight minutes. Eight minutes! All this to review a play that lasted less than 5 seconds. What were they doing in there, grabbing a beer?

And the usual delay factors that afflict nearly every game were present: Too many catcher-pitcher meetings at the mound, too much time between pitches, too many visits by pitching coaches and too many players futzing at the plate between pitches.

Boston Red Sox

In the seventh inning, leading by five runs, Red Sox manager John Farrell replaced pitcher Alex Wilson with Craig Breslow despite the fact that Wilson had struck out the previous two men he faced, the last one on three pitches. Was this really necessary with a five-run lead? (Breslow gave up a run-scoring single on the first pitch.)

In the eighth, Rockies pitcher Josh Outman backed off the pitching rubber with the batter in the box and took a deep breath to compose himself. The Rockies were trailing 10 – 4 at the time. Just throw the damn ball!

Tough Love

I love baseball more than anything except my wife, my kids and writing, and that’s why I’m so frustrated to see the game turning itself into such a grinding ordeal. The average length of a major league baseball game has increased from less than 2:38 in the 1970s to nearly three hours today, according to the baseball Wikipedia entry. In the 1940s, the average was less than two hours. I still remember watching Jerry Koosman pitch a complete game in the final match of the 1969 World Series. Complete games are almost an oddity today.

There have been many proposals to limit the length of games. Here’s a good roundup published last year. In my view:

  • Major League Baseball needs a pitch clock. If the pitcher doesn’t deliver in time, it’s an automatic ball.
  • There should be a hitting clock, too. Batters spend too much time adjusting their batting gloves and grabbing their crotches. Step up and swing.
  • Catchers should be prohibited from meeting with pitchers at the mound. That’s what signs are for. Do your homework in the dugout.
  • Pitching coaches should be limited to one meeting at the mound per game. The purpose of those meetings is usually to give relievers time to warm up, anyway. So get your relievers up earlier.
  • Pitching changes should be limited to two per inning. OK, maybe that takes an element of strategy out of the game, but it’s ludicrous that pitchers should walk in from the bullpen and go through a full warm-up cycle to throw only one or two pitches. Screw the righty-lefty percentages in that case.

Purists may argue that time limits undermine one of the distinctive characteristics of baseball, which is that it isn’t played by a clock. I’m a purist at heart, but I’m also practical, and I don’t want to see a scenario in which only the purists attend games. People once said the 24-second clock would ruin basketball, but I don’t see anybody protesting today.

People have complained to me for years the baseball games are too long and boring. I’ve always argued that they’re failing to understand the important strategic nuances of the game, but now I’m beginning to agree with them. I’ll never stop being a baseball fan, but my frustration with sitting in the stands during interminable and unnecessary delays is growing. This will probably be my last year as a season ticket holder. I just don’t have the time.

Enhanced by Zemanta

Update 7/12/13: The Wall Street Journal published an analysis of a sampling of Major League Baseball games that found that the average three-hour game contains less than 18 minutes of action. The biggest time sink: Time between pitches at 51:27.

TheCUBE is Traveling Tech TV

The folks at Wikibon and SiliconANGLE have been traversing the country for the last two years with a cleverly packaged portable streaming video platform they call TheCUBE. They touch down at the site of a technology conference, stake out a couple of hundred square feet of floor space and start pulling in speakers and attendees for interviews. The interviews are streamed live online and archived on the SiliconANGLE Network channel on YouTube. At the recent EMC World Conference they blew through 72 video interviews.

Wikibon founder Dave Vellante is clearly having the time of his life, and they’re making money, too. Conference organizers and sponsors pay for the coverage. Here they are at this week’s IBM Edge conference in Las Vegas, where TheCUBE is at the center of the action and the interviews are playing continually on screens around the conference floor. Congratulations to Dave and John Furrier for a great and well-packaged idea.

TheCUBE at the IBM Edge Conference


Security Tips for Social Netizens

I’ll admit that I was taken in the first time I got a tweet like this:

“You gotta see this! lolol bit.ly/ZUT…..

I haven’t been fooled since, but I’m sure plenty of people are fooled every day, particularly when the come-on is from a person they know.

The difference between the Nigerian princess plea, the PayPal password reset email and other famous online security scams we know and love is that social networks make it appear as if the requests are coming from your friends. How can you not stop to help out a friend who’s marooned in an overseas village somewhere after his wallet and passport were stolen?

Digital Defense,a security assessment and software firm, has published this free guide to the most common security dangers in social media. While experienced netizens know that you never click on a link without first checking out the URL, for the vast majority of casual users don’t know how to do that (hint: hover over the link). This free download is worth sharing with the people you work with, and any IT organization should make it required reading for users.

Note, you have to fill out a registration form to download it, but the company doesn’t ask for much. Also, I received no compensation for this post.